Challenge
Increase conversion and customer satisfaction scores
My role
UX Designer
What was done
- Research
- Journey mapping
- Data tracking structure and roadmap
Outcome
- Mapping of usability issues in the flow
- Google Analytics tracking plan for events user interactions and drop-off points.
Background
The product lacked proper tracking of the user experience, resulting in a lack of valuable data that could be used to make informed changes and increase the number of users completing the flow and due not enough resources back then the company was using the qualitative data from customer satisfaction comments to drive improvements.
As we only had quantitative data on the total number of users who started and finished the flow it was difficult to comprehend what was happening during the user journey while using the product and where/what was causing the drop offs before the end of the flow.
Process
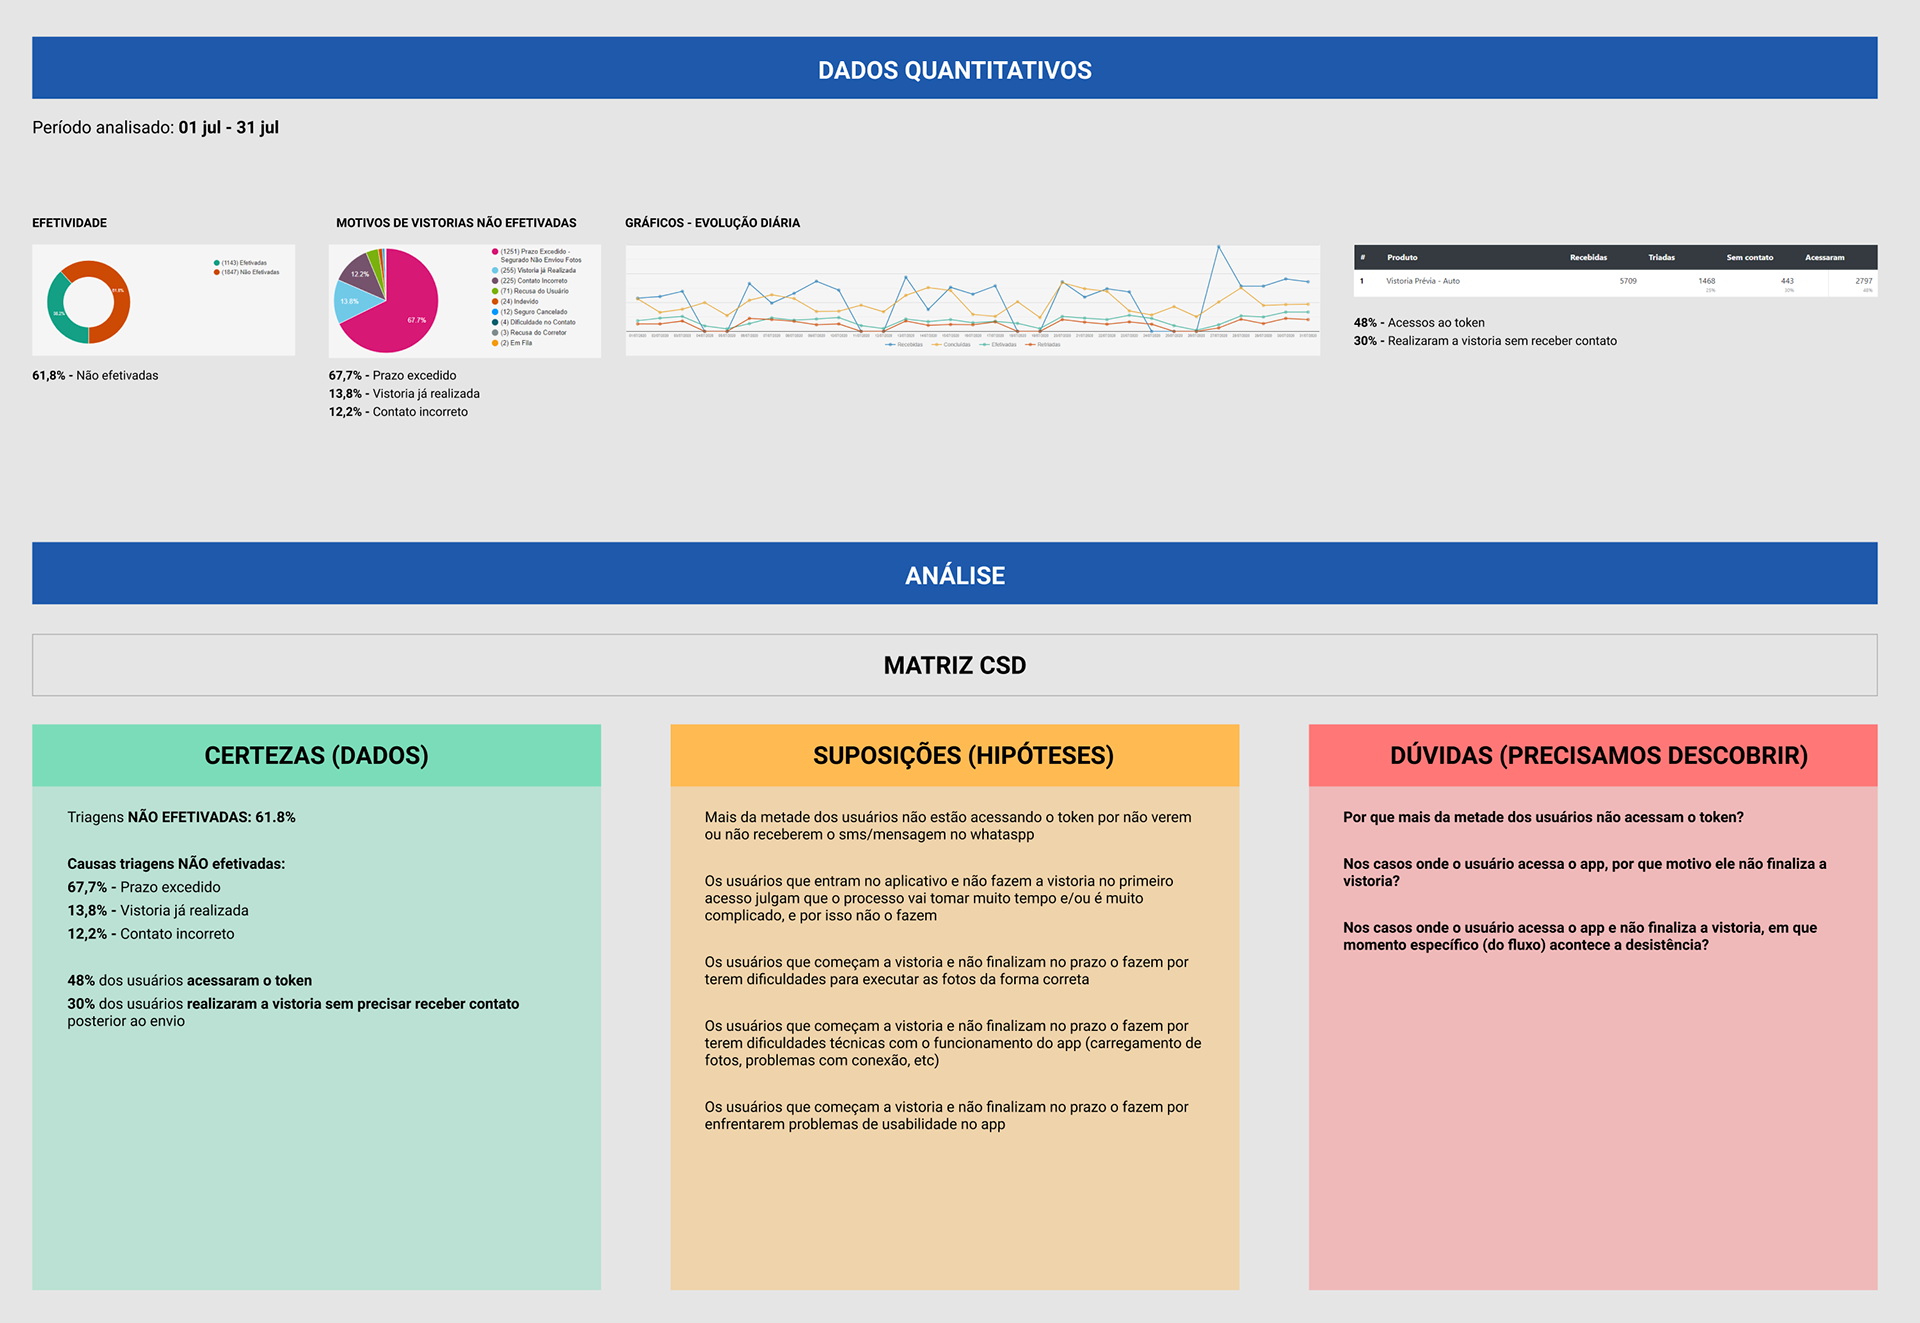
To address these issues, a comprehensive research process was undertaken. The analysis began with examining the qualitative data from the Customer Satisfaction (CSAT) system within the company, which provided open-ended comments and satisfaction scores from customers. By analyzing the entries over a 30-day period, patterns of issues that users encountered while using the product were identified.
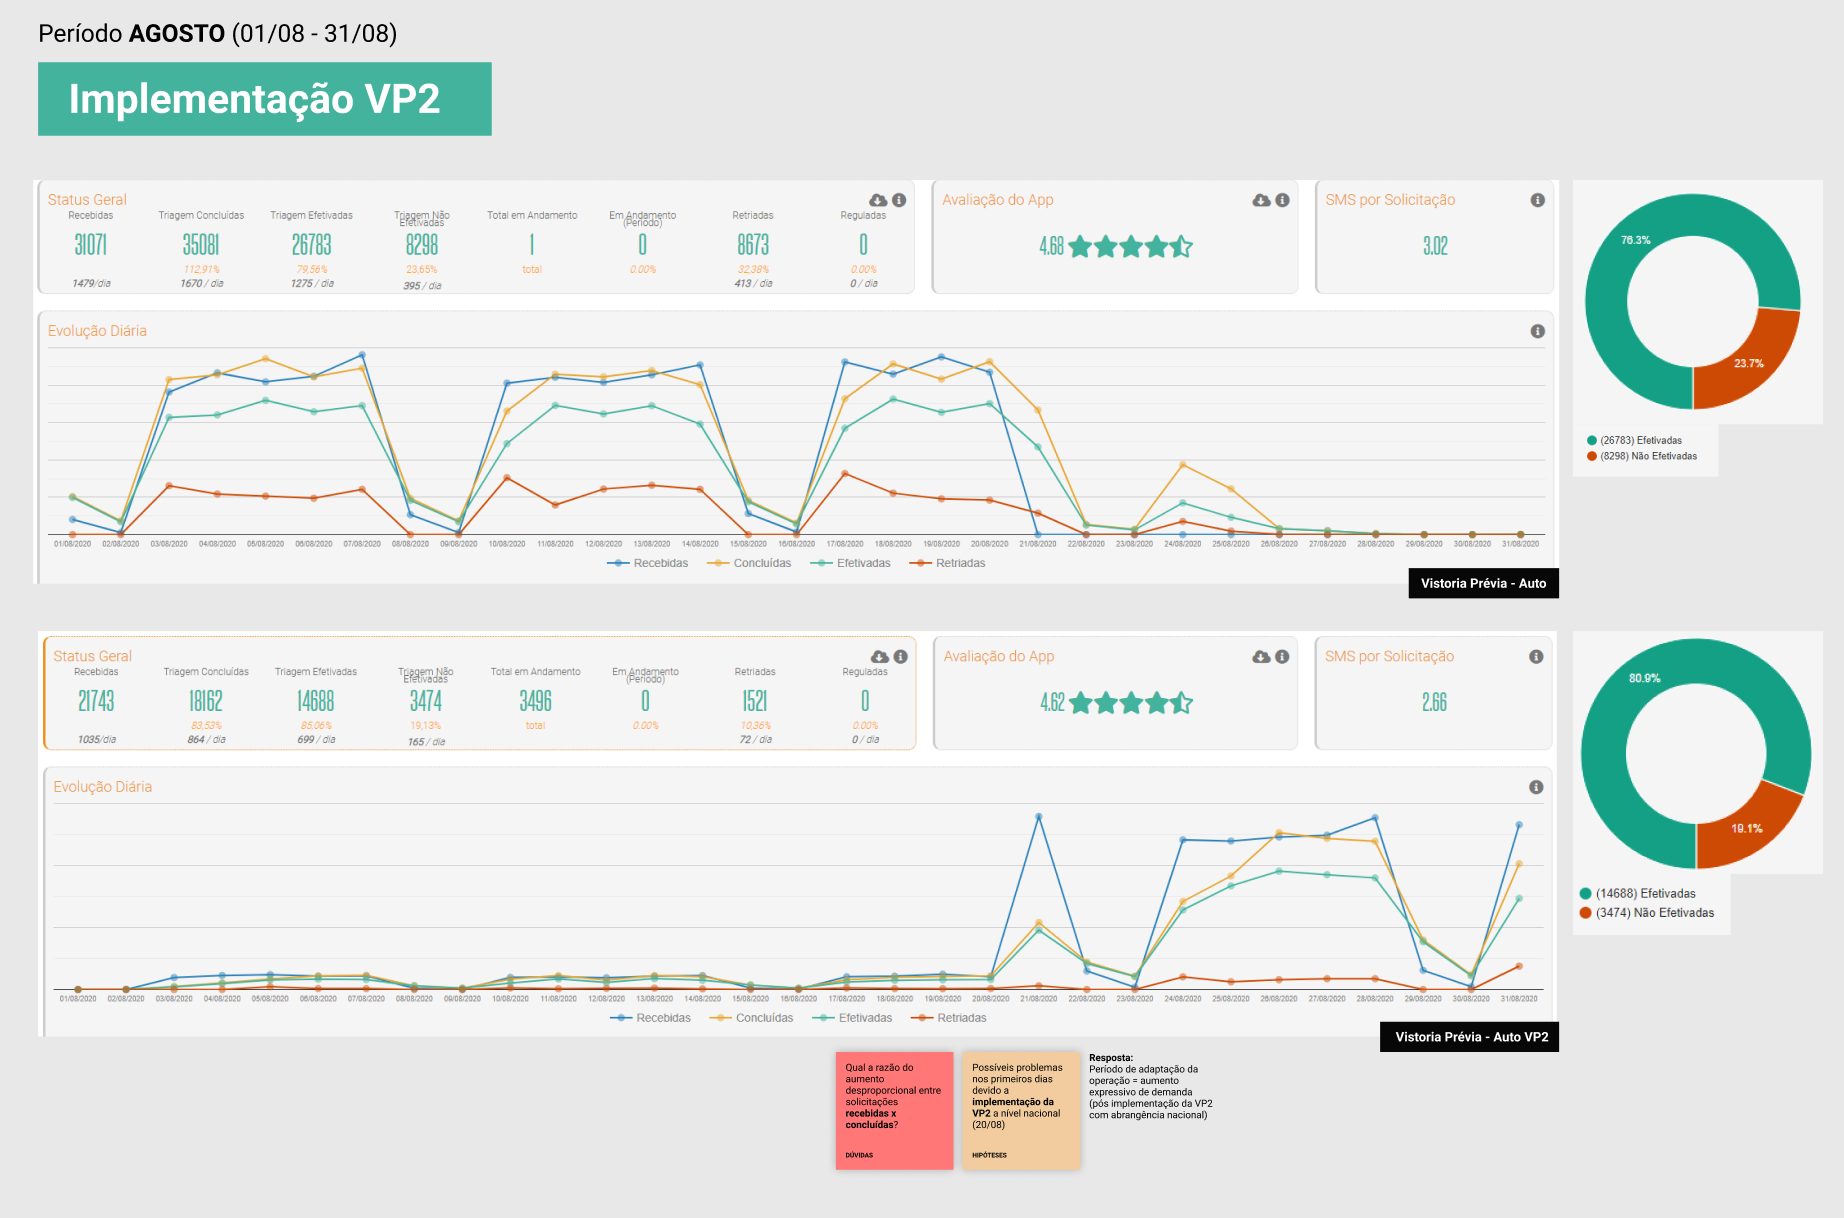
Quantitative data analysis was also conducted using internal dashboards to gain insights into the overall performance. It was discovered that the conversion rate of users completing the flow could be higher considering the total number of users who started the process.
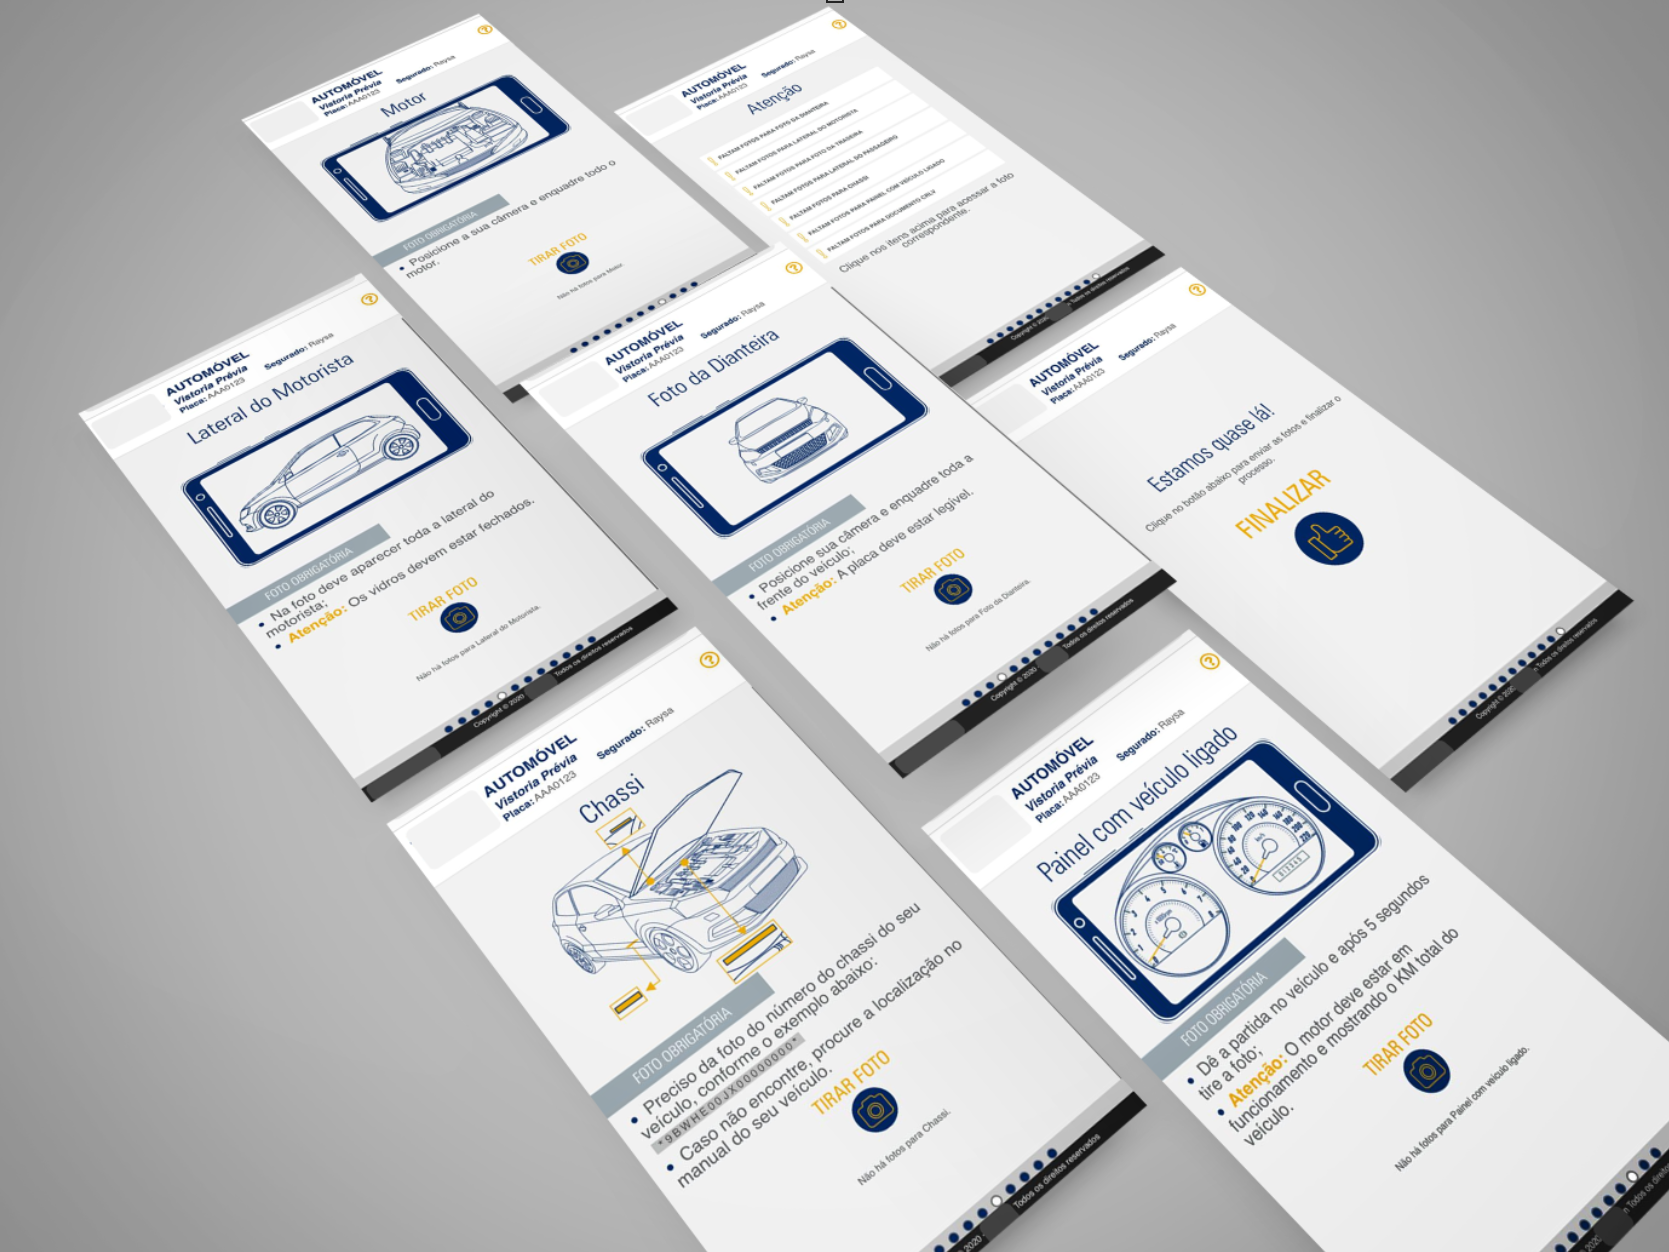
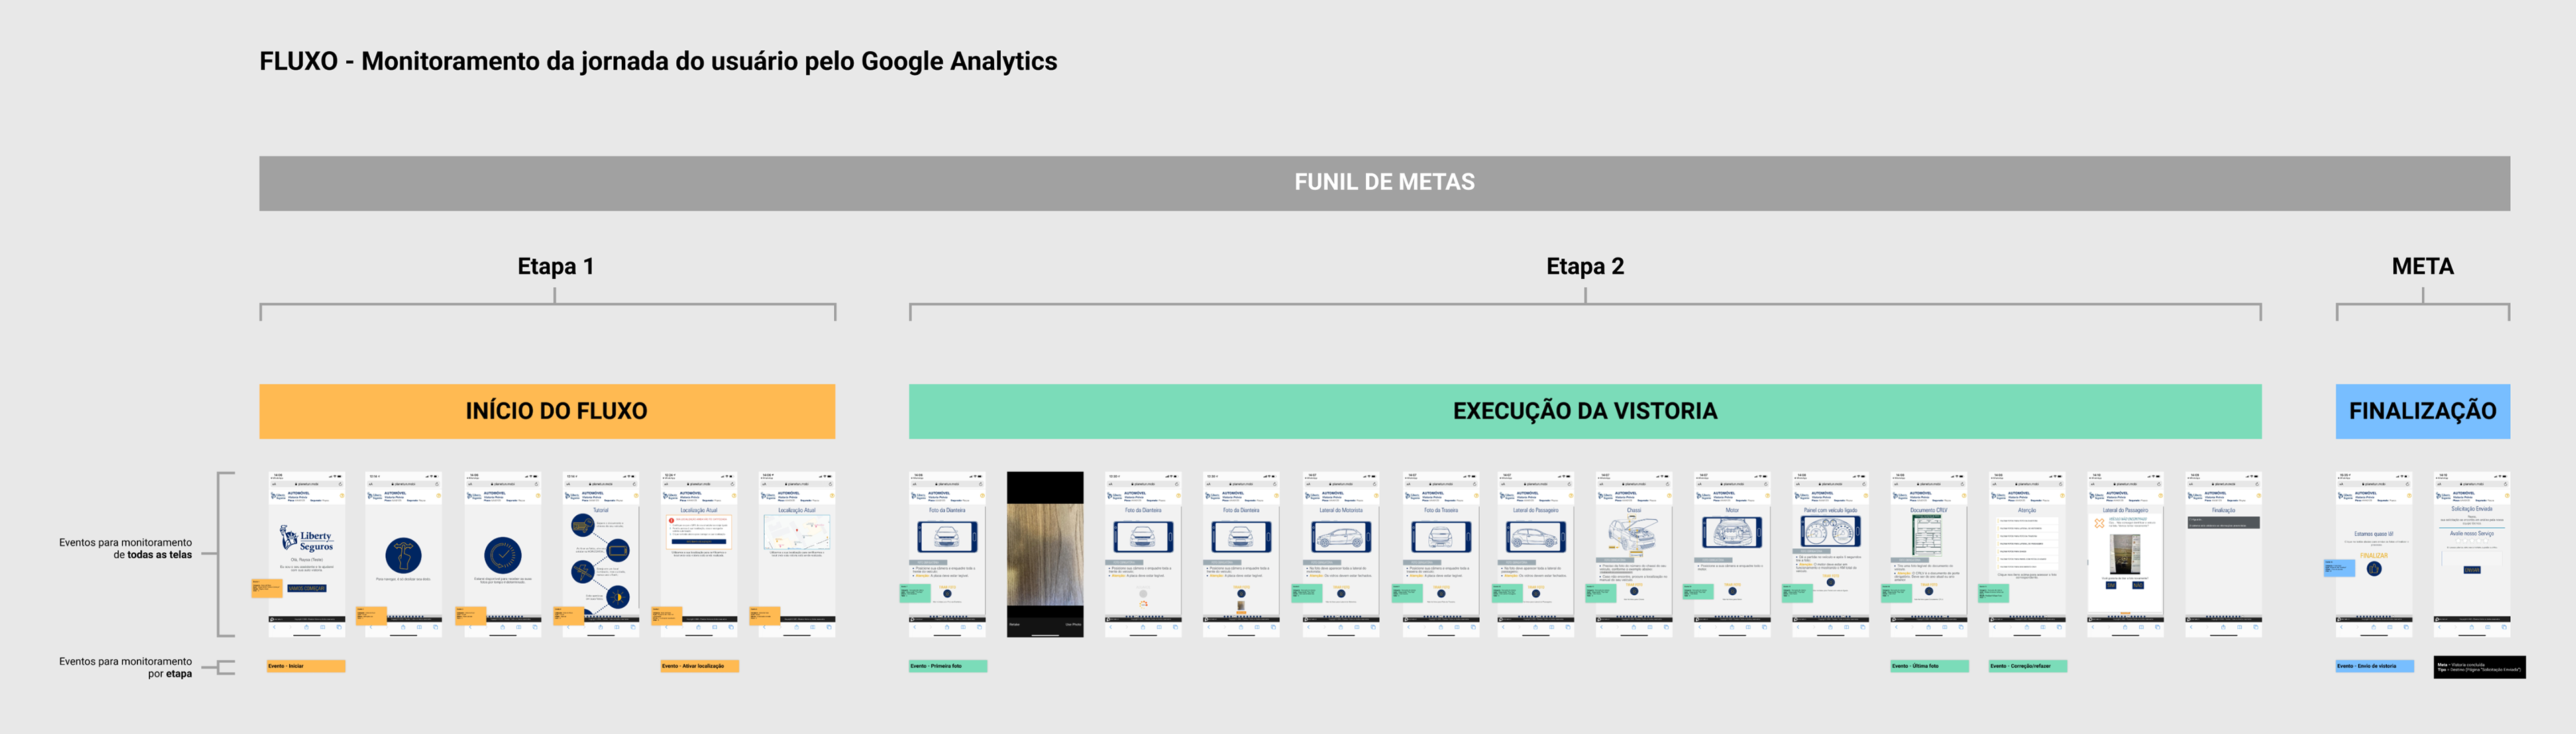
To gain a holistic understanding of the user journey and potential usability issues, a journey map was created, mapping the entire flow from the first to the last screen. This map served as a foundation for identifying areas of improvement and developing a plan to track the entire flow.
The analysis of both quantitative data from internal dashboards and qualitative data from customer comments and reviews was compiled and organized into a CSD matrix (Certains, Suppositions, Doubts). This matrix facilitated the comprehension of information and prioritisation of improvements.
The journey map, combined with the analysis of customer reviews, provided insights into possible usability issues and UI improvements that could help users progress further in the flow. It also aided in identifying breakpoints within the flow and defining how to leverage Google Analytics effectively to track user interactions and identify drop-off points.
- The plan for implementing analytics was developed according to the map flow with 2 steps and also the mapped usability issues in some screens of the overall flow in order to provide information if users were struggling with some possible issues.
- With the data from the analytics funnel we could identify the most critical pages that needed to be reworked to focus on.
- Also the changes would be followed from validation with users through usability tests with prototypes and then with a final design the iterations would be developed.
Results and takeways
The process allowed the identification of possible usability issues that could have impact in overall performance, conversion and CSAT score and the main result was the Google Analytics structure for data gathering and tracking and also a roadmap of improvements in the flow screens that would enhance product performance, expand customer base and increase conversions.